


Bitcoin & Fibonacci. The Beauty Of Mathematics And Cyclical Nature.

Welcome back.
I think this week captures the essence of the saying “market sentiment can turn on a dime.” After reaching a new ATH of $68,950 on Wednesday, we’ve been facing increased selling pressure from the Evergrande fiasco, and now even more due to the SEC rejecting VanEck’s Bitcoin ETF. This is precisely why it’s important to stay level-headed and never give into hype or fear.
Crypto YouTube is full of zoomed-in shocked faces with captions reading “$250,000 Imminent!” or “OMG. Bitcoin Crash?” Crypto Twitter is not any different with all the rumors, scams and thousands of bots promoting the damn meme coins. Try to tune out the noise. They neither help your portfolio nor your sanity. But I am writing this week’s post early to give you another perspective and hopefully ease your concerns. I remain long-term bullish.
Bitcoin is code. Bitcoin is math. Bitcoin is supply and demand. Bitcoin has halvings every four years. My point is that Bitcoin is built on an arithmetic foundation and follows rigid but simple rules that dictate its scarcity, and therefore, its value. I believe they are some of the biggest reasons behind the similar patterns we see in different cycles. Let’s look at them with Fibonacci.
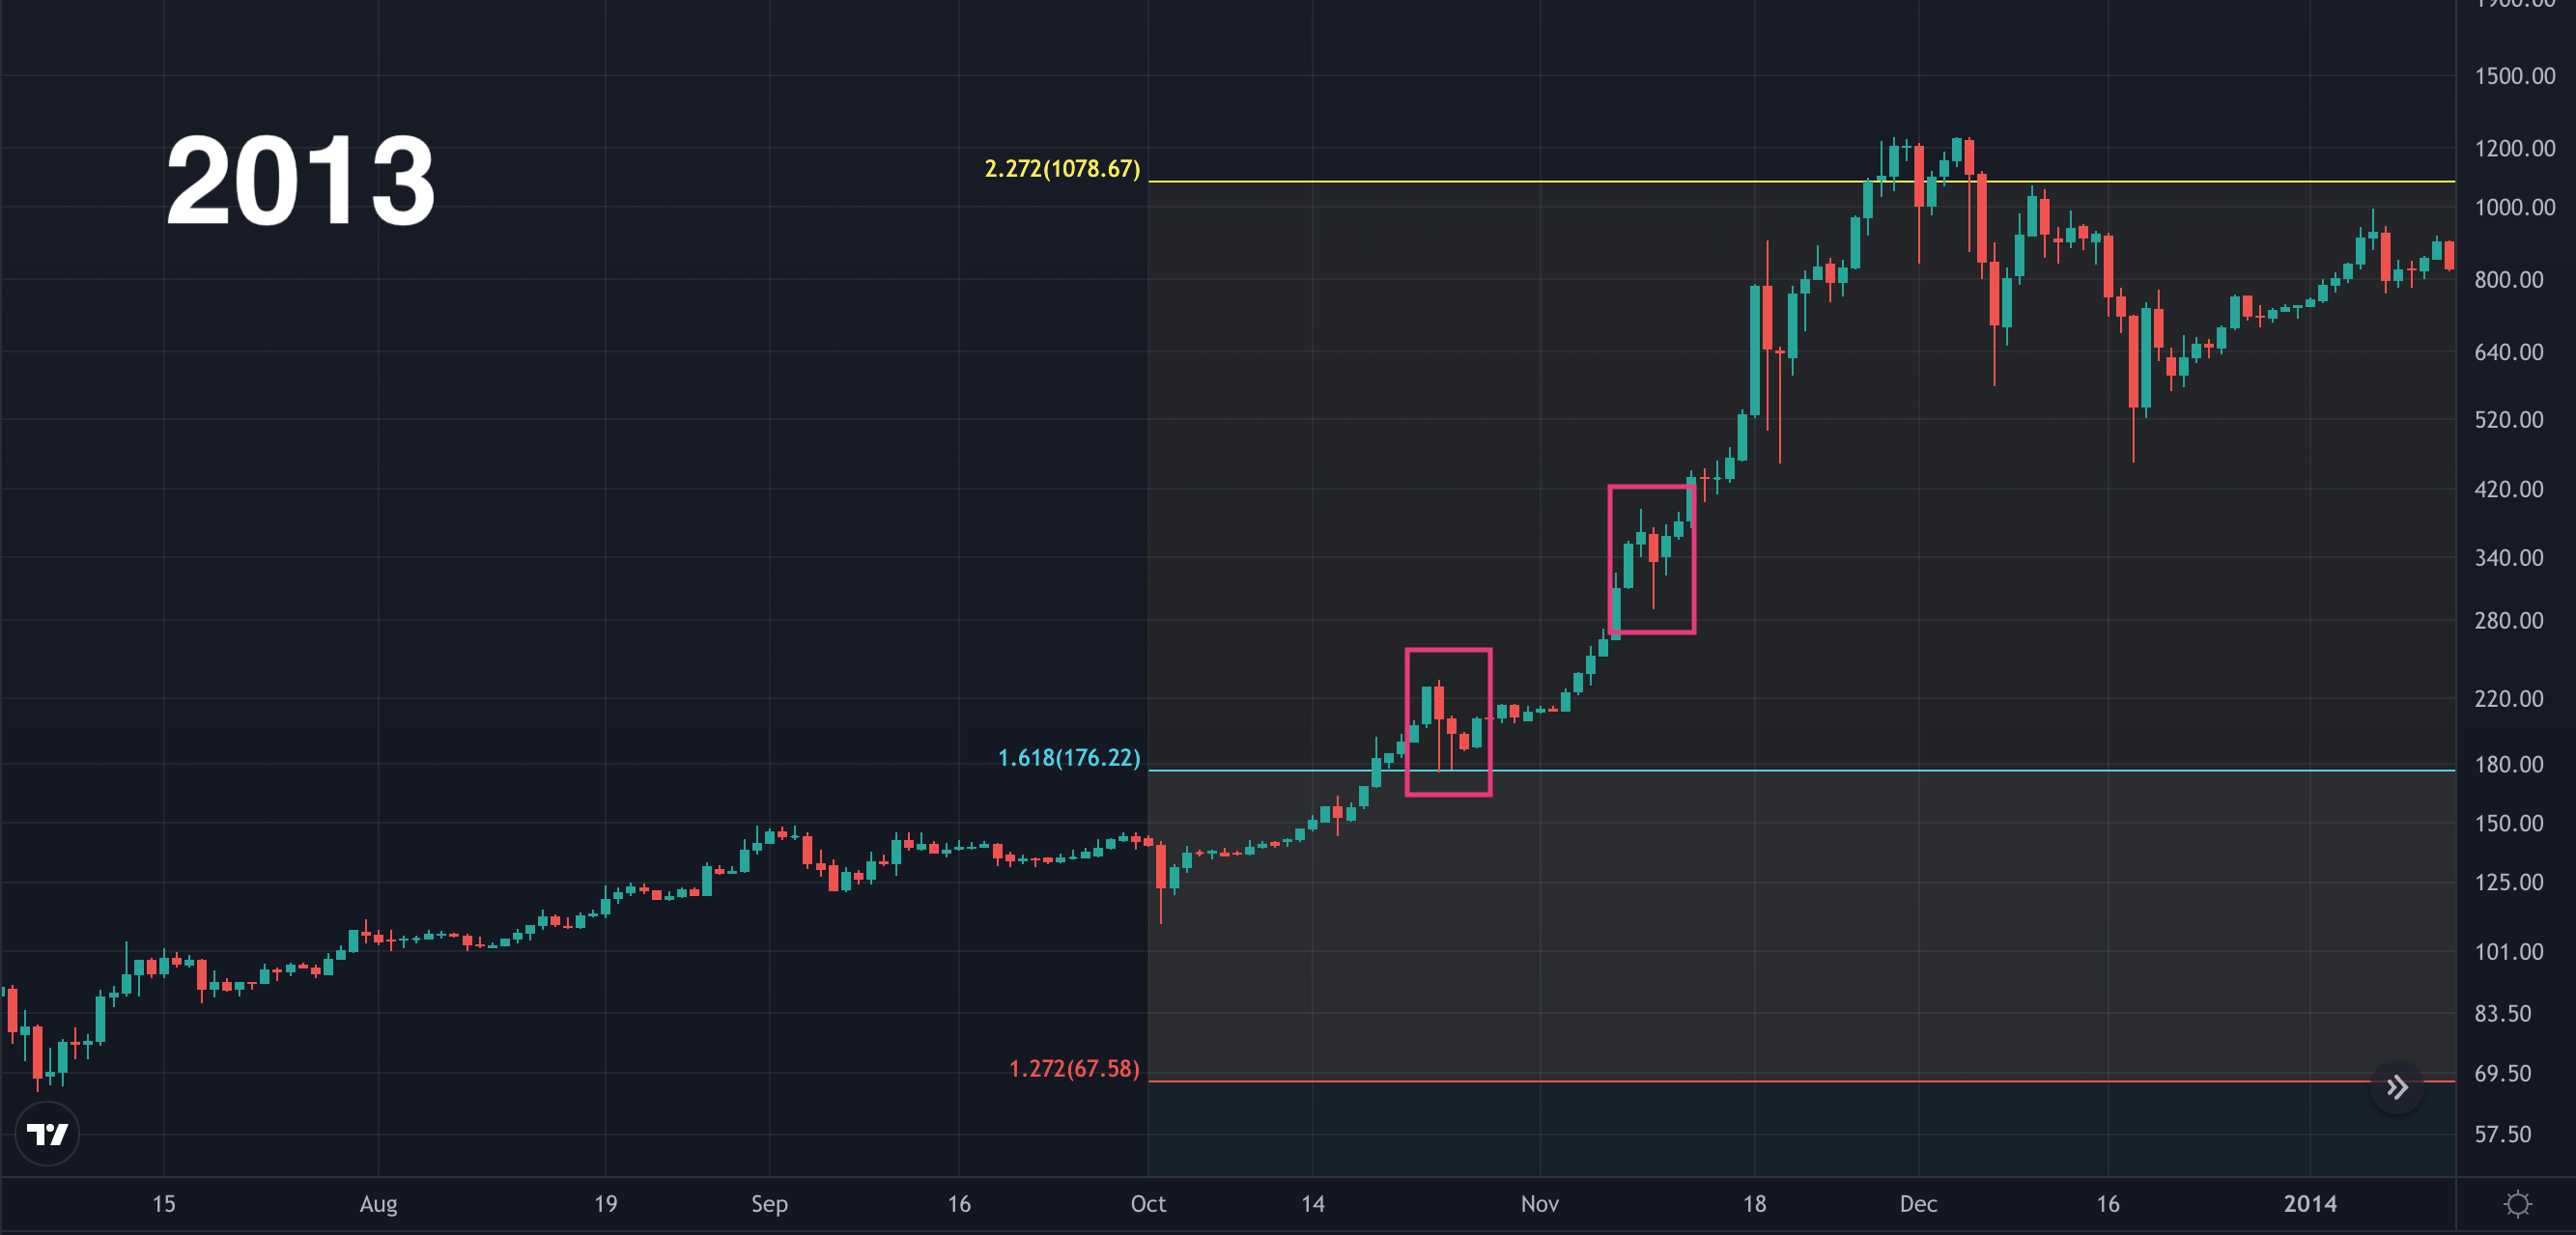
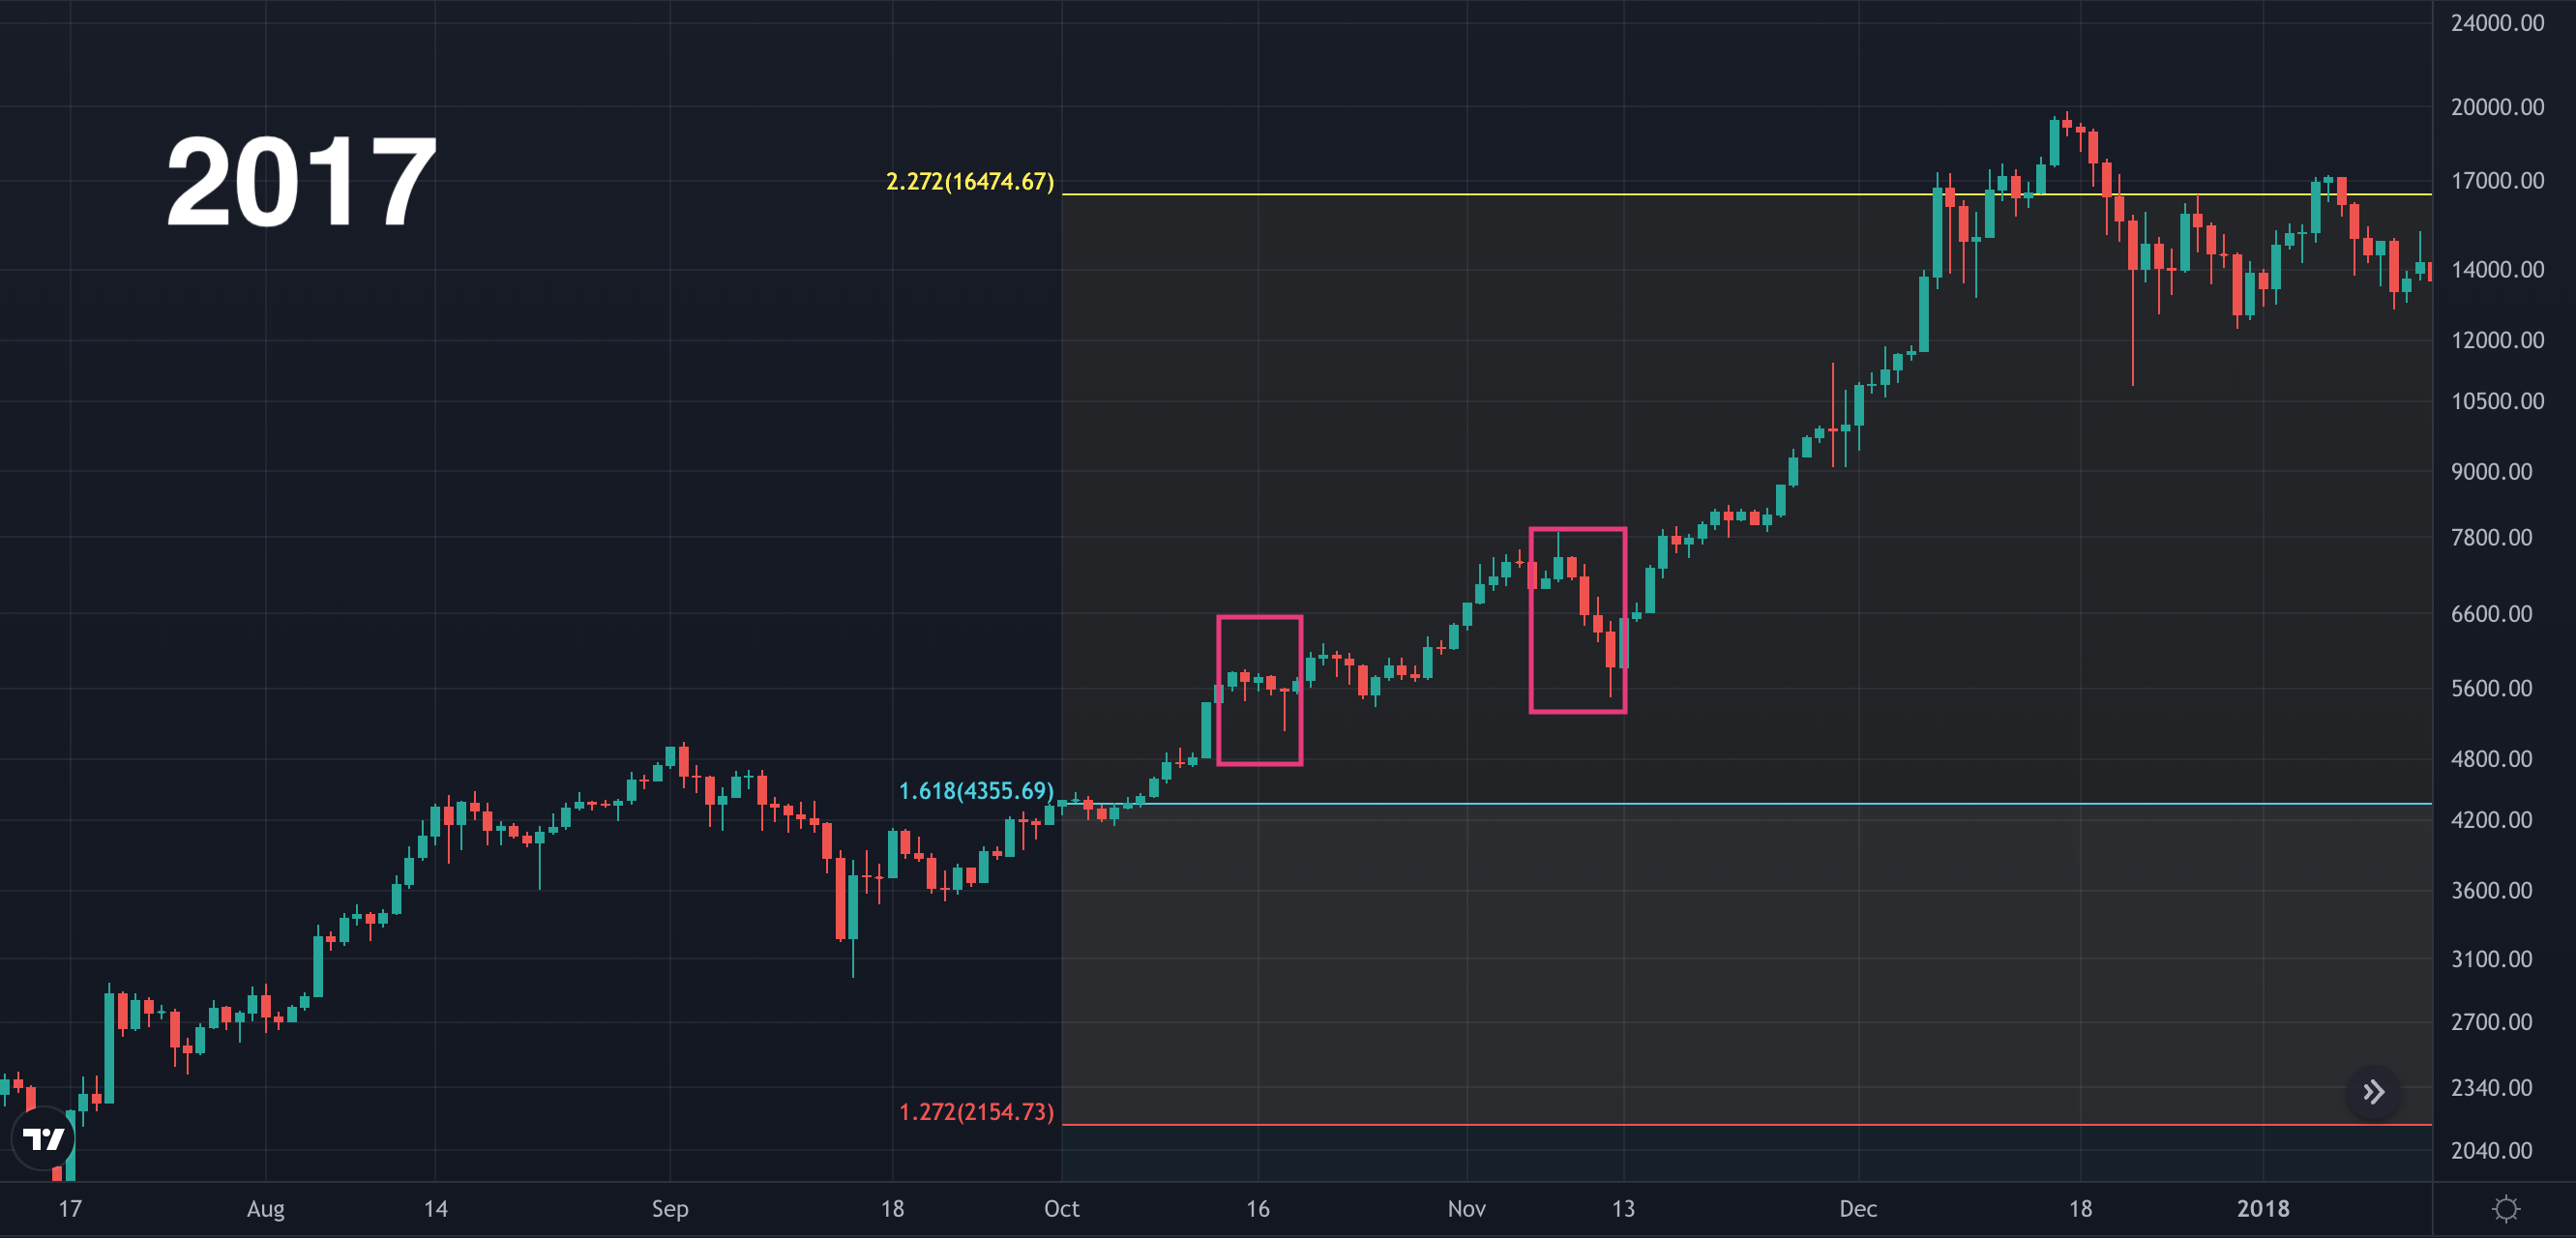
If you use Fibonacci Retracement to connect cycle tops and bear market bottoms, you would get this. There are other ratios based on the Fibonacci sequence but I have found these to be the most important in finding long-term support and resistance levels for Bitcoin. This has been the story so far: Break 1 after years of accumulation, climb quickly to 1.618 to get rejected, find support at 1.272, successfully break through 1.618 on the second try, then a parabolic run to 2.272.
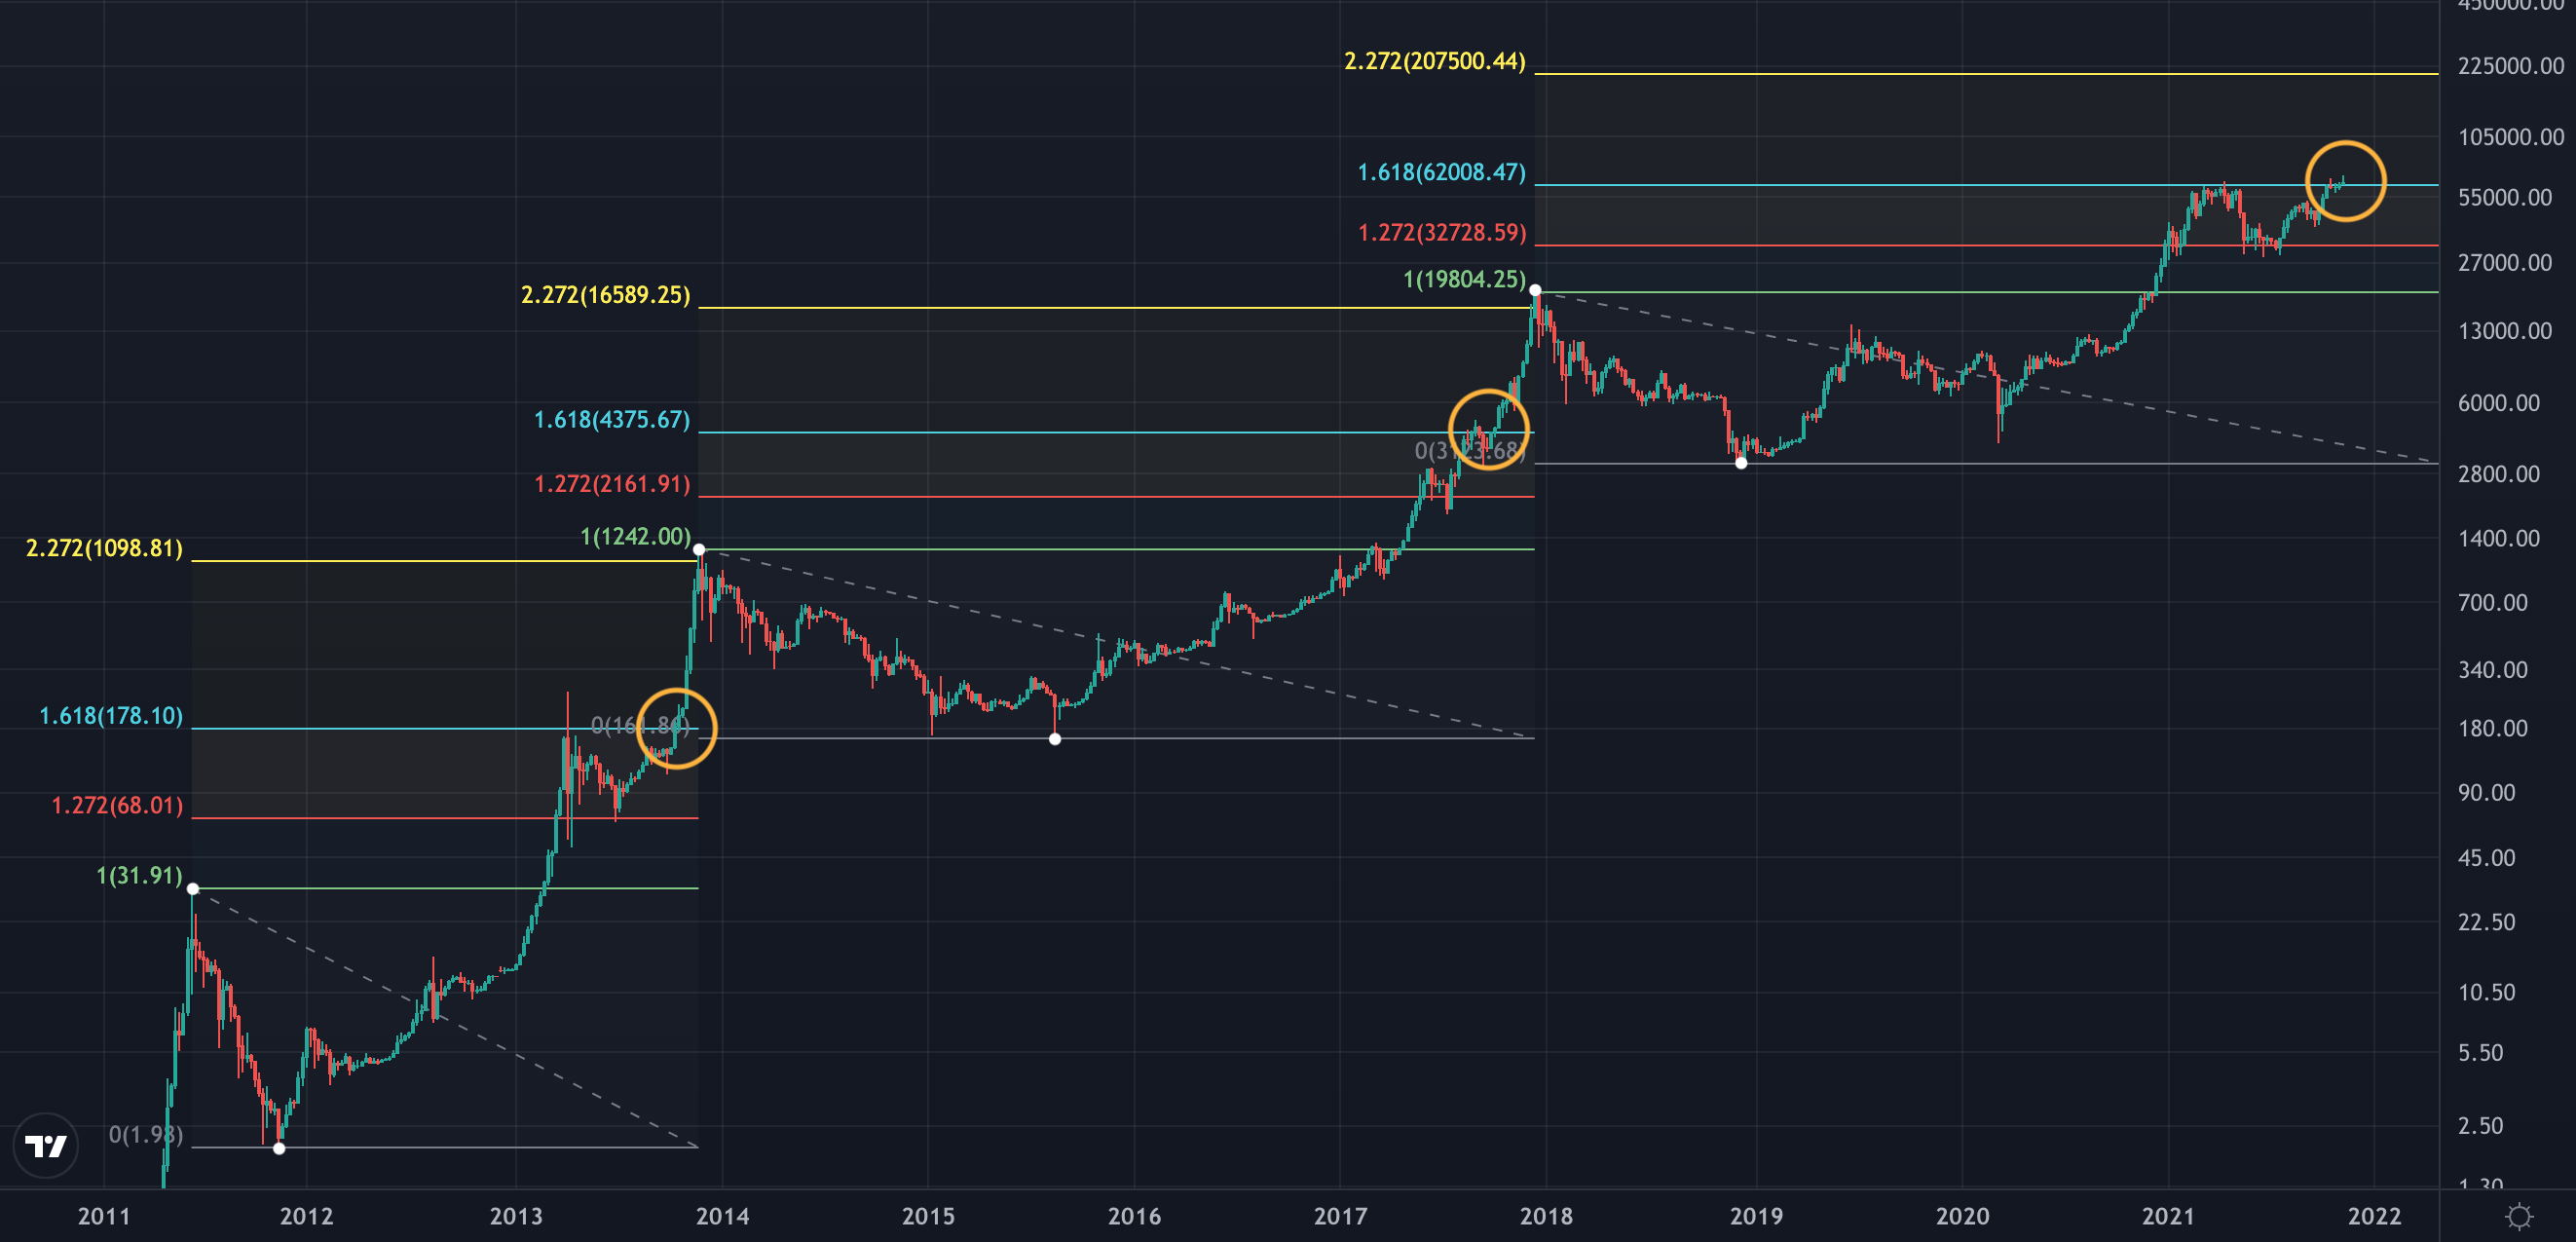
In hindsight, the 60% crash in May was simply coming down to 1.272 to confirm it as support. And we are now peeking above 1.618 and seem to be in consolidation mode. There are of course no guarantees in crypto but I’m still waiting for the final parabolic run. I don’t know when. Nobody knows. So I’m just being patient for now and looking to take profits on the way up (never try to time the top though). Here’s a closer look at where we are compared to 2013 and 2017. Remember, dips are healthy and part of the journey.

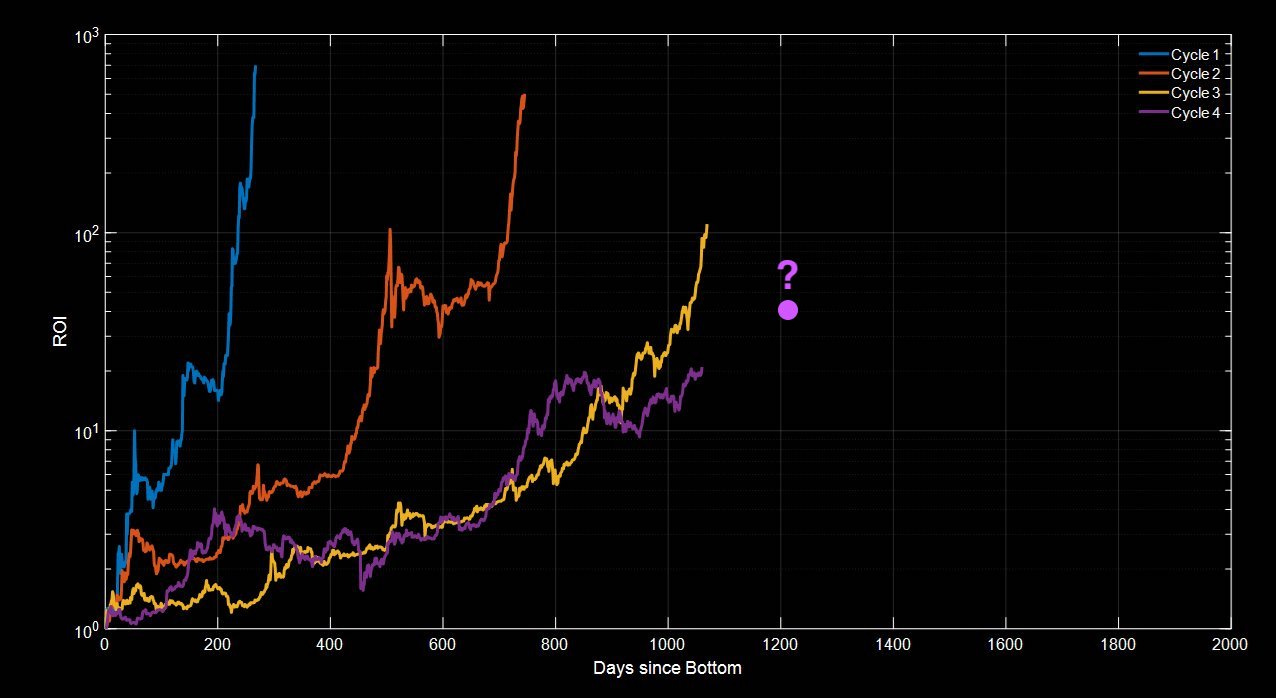
That said, the story is similar but not the same. First, Bitcoin is becoming less volatile compared to previous cycles. It probably still feels too volatile to most but it is maturing as more users join and as its price increases. Second, ROI is decreasing, meaning Bitcoin is indeed becoming a more stabilized asset. Third, the cycles seem to be lengthening so the peak might not happen in December but Q1 of 2022 or even later. These factors will change how high we can go, when that will be, how low we can go and more.
All something to think about as you navigate the market and form decisions that make sense for your portfolio. You probably know by now that I like to keep my targets on the conservative side and I never give definitive predictions (if I do, it’s just for fun). But if I’m to be truly definitive about one thing, it’s this. Time is on our side. I learned that from Ben. That’s why I remain long-term bullish. I’ll leave you with a few comparison charts and on-chain analyses to mull over. Cheers and see you in the next one.
Return On Investment — 2011, 2013, 2017, 2021 (Credits to @intocryptoverse)
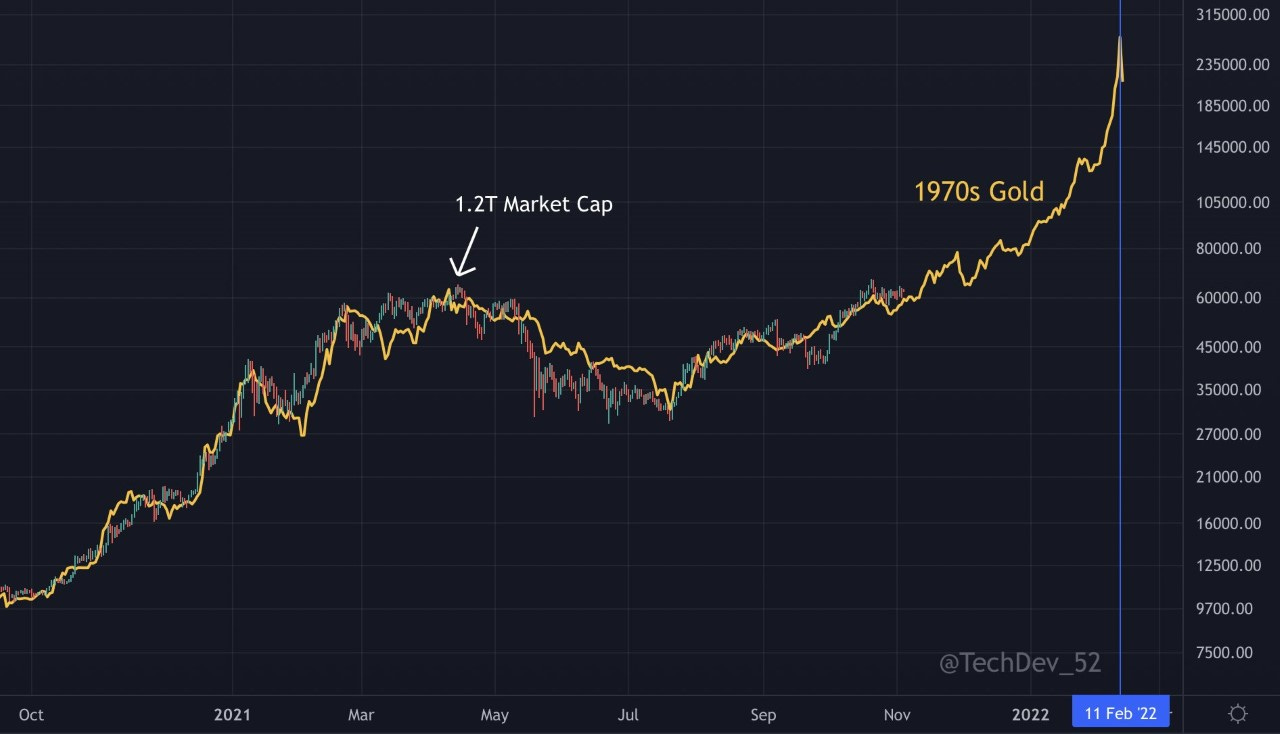
2021 Bitcoin vs. 1970s Gold Fractal (Credits to @Techdev_52)
Distribution Phase vs. Accumulation Phase (Credits to @WClementeIII)

Bitcoin Supply Left On All Exchanges (Credits to @glassnode)
