


What Happened To Moonvember? 10 Technical Analyses That Show We're Not Done Yet.

Welcome back.
Let’s answer the elephant in the room. What happened to Moonvember?

Compared to October, November feels far from going to the moon. I guess the lesson to take away from this is that what everyone expects to happen rarely happens. On the bright side, November not being as bullish makes me more bullish for December. This is what I’m thinking overall: summer was the reaccumulation, October was the breakout to the upside and we used this month to do necessary retests.
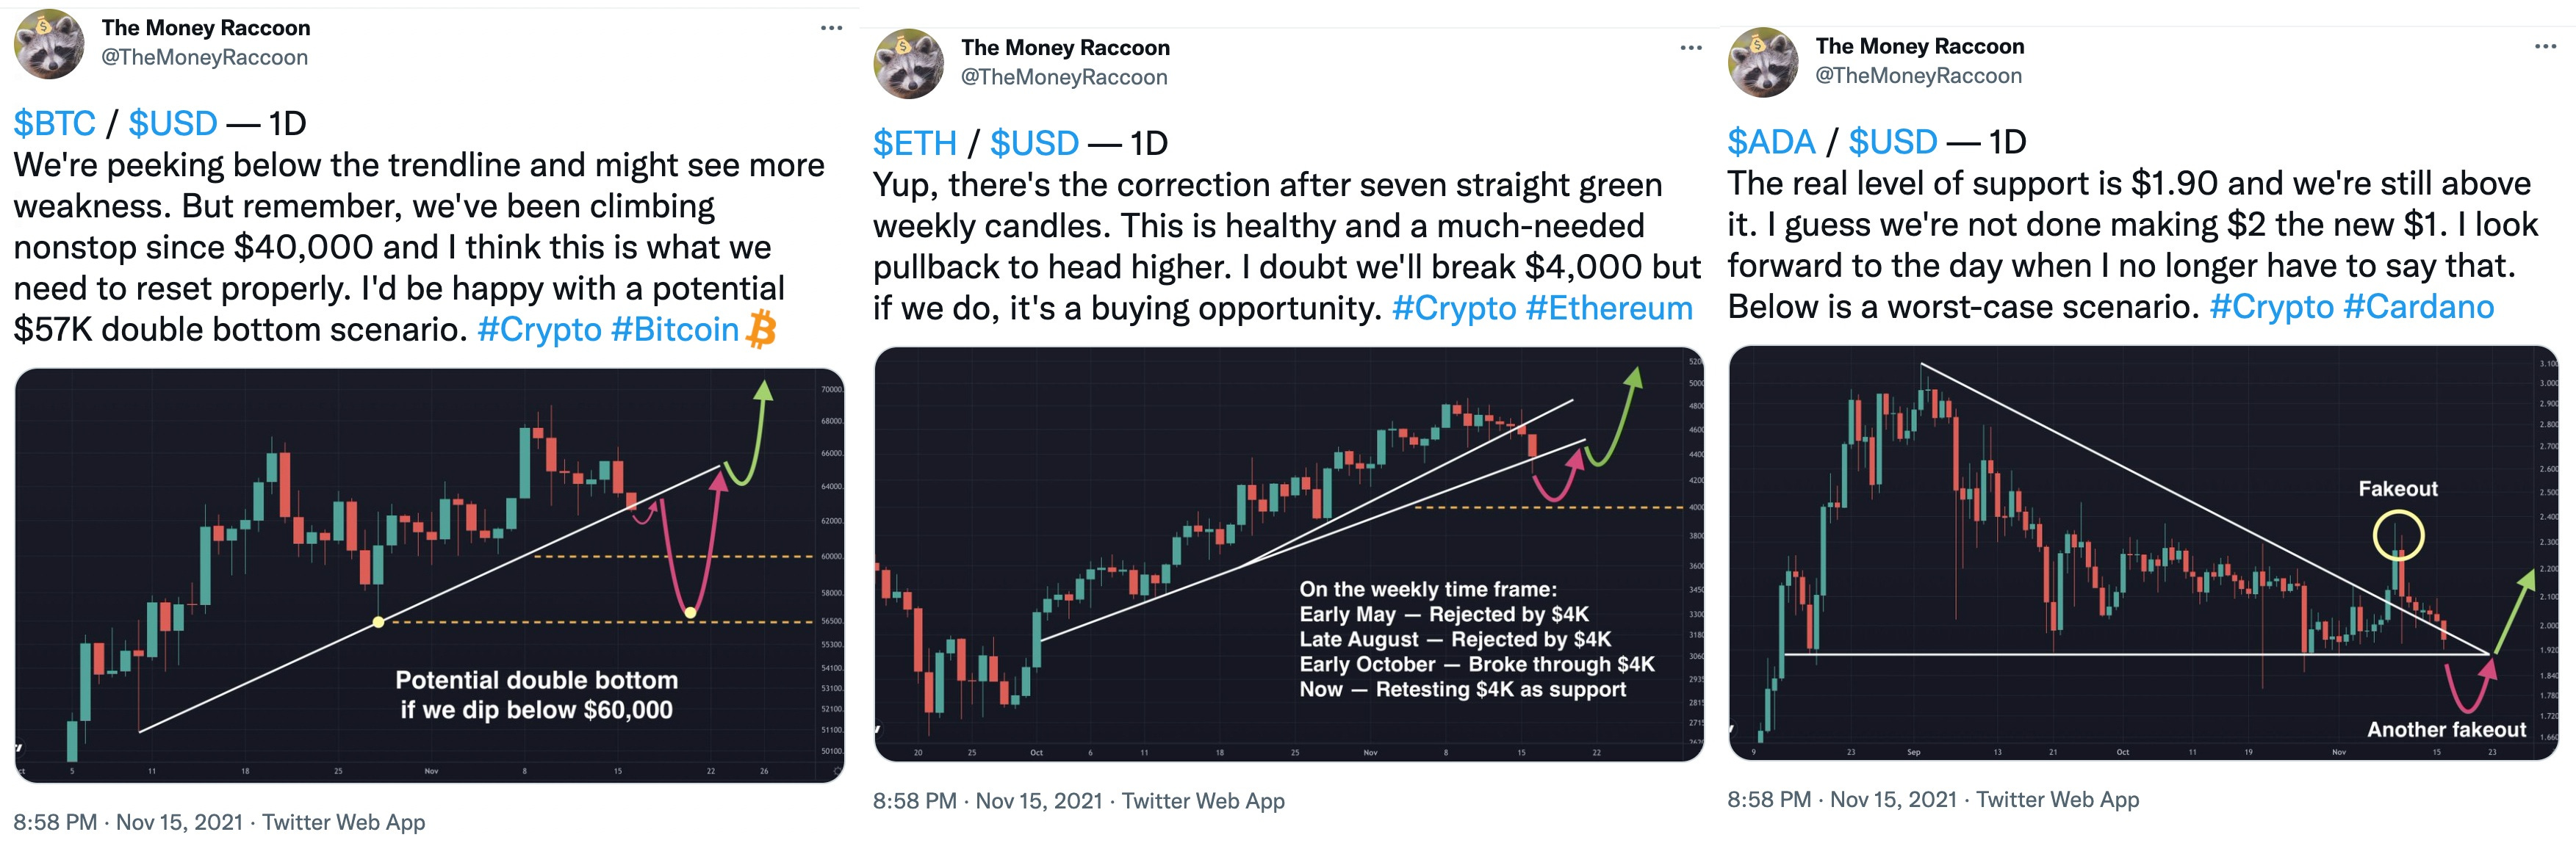
The macro bull market structure is still intact and this was the healthy pullback we needed to refuel. Plus, the following scenarios I shared last week for Bitcoin, Ethereum and Cardano are all playing out accordingly so far. If you disagree with any of these points, please let me know. I always appreciate different inputs and perspectives.
I believe now’s the time to be patient and recalibrate your profit-taking plan. When I officially turn into a bear, I’ll let you all know. But enough yammering from me. Let’s look at charts and numbers. Here are 10 technical analyses that show we’re not done with the bull run yet. Some say “meh, not entirely out of the woods at least in the short-term,” but most seem to point to new ATHs.
Final Impulsve Elliott Wave: Large impulsive waves (I to V) are made up of smaller impulsive waves (1 to 5). We’re still below $60K so we may not be done with the short-term ride down to 4 (maximum pain to $53K although I doubt it will happen), but keep your eye on the big prize.

Logarithmic Fibonacci Ratios: Check out last week’s article for a more in-depth look into the beauty of mathematics. Historically, every bull cycle has shown a parabolic run to 2.272 after breaking out of 1.618. I don’t know how fast or exactly when but I know time is on our side.

Relative Volatility Index: When RVI is above 50, it indicates that the volatility is to the upside. If below 50, downside. We’ve been above 50 since the start of the bull run in March of 2020, except for a few outliers during the summer. I expect more zigzag spikes to the upside.

Vortex Indicator: Uptrend (Blue+) and downtrend (Red-) are closing in on each other. But it’s not a red flag because corrections in bull markets create these brief near-convergences or “fakeouts” before resuming the run. I expect these lines to start moving away from each other soon.

Macro Uptrend: Unlike the summer lull when bears were temporarily in charge, the trend is now with the bulls. This is why it’s important to look at the big picture. This looks incredibly healthy to me and makes the 20% dip look like nothing. Don’t be shaken out. Zoom out instead.
50 & 200 Daily Moving Average: We need to close above $60K to reclaim 50D MA. It’s acting as resistance now so we’ll see if we can break it this coming week. Doing so will teleport us to $70K quickly because we’ve cleared excess leverage that’s been piling up since $40K.

21 Weekly Exponential Moving Average: No surprises here. We’re still above 21W EMA, an important bull market indicator for Bitcoin. I think we’re oversold but if we somehow drop further to $53K, I still wouldn’t mind it because I expect 21W EMA to act as extremely strong support.

Moving Average Convergence Divergence: The bull momentum has indubitably slowed since the start of this month. But similar to Vortex Indicator, there’s no red flag yet because briefly plateauing or inversing the slope is common in bull runs. We’ll watch this closely, however.

Relative Strength Index: This is the chart that makes me sad because I was so excited to see it get above 70. We’ve been rejected for now. It certainly doesn’t call for immediate bearishness though. It just means we have to wait a little longer than we had expected. But patience pays.
Ascending Triangle: It’s not the cleanest or most bullish retest I’ve seen (compared this to Ethereum’s retest), but everything looks relatively healthy. Let’s see if we can close out November strong above $60K, so we can make December a month to remember and start taking profits.

In summary, I think we’ve cooled off properly and are in a good position to head into December. If we see crazy green candles in December, I’ll be taking partial profits (will tweet when I sell). If the price growth is not as explosive, please be open to the idea of the bull run extending to Q1 of 2022. Thank you all for reading and see you in the next one. Cheers.